
Power BI Course in Chandigarh: Learn Data Analytics, Build Dashboards & Become Job-Ready
Data is now one of the most valuable resources for modern businesses. Companies collect large amounts of data from sales, customers, operations, finance, marketing, and other business activities. But collecting data is only the first step. Businesses also need skilled professionals who can analyze data and turn it into useful insights.
This is where Microsoft Power BI becomes important.
A well-designed Power BI dashboard can transform complex business data into interactive charts, reports, KPIs, and visual insights. As organizations continue to adopt data-driven decision-making, professionals with practical data visualization and business intelligence skills are finding opportunities across many industries.
If you are looking for a Power BI course in Chandigarh, The Core Systems offers industry-focused training designed for university students, freshers, working professionals, and aspiring data analysts.
The training focuses on practical learning rather than only theoretical concepts. Students can learn how to import data, clean datasets, create relationships, use DAX, build interactive dashboards, and present business insights in a professional way.
Whether you are starting your career in data analytics or want to add Power BI to your existing technical skills, learning Power BI can be a valuable step toward becoming a job-ready data professional.
Why Learn Power BI in Today’s Data-Driven World?
Organizations need more than spreadsheets and static reports to understand their data.
Power BI helps businesses create interactive and visually understandable reports from different data sources. Instead of manually checking thousands of rows, analysts can use dashboards to identify trends, compare performance, and monitor important business metrics.
Power BI is widely associated with the Microsoft ecosystem and is used for business intelligence and reporting across different industries.
Some common applications include:
- Sales performance analysis
- Financial reporting
- Customer analytics
- Marketing analysis
- Human resource reporting
- Inventory analysis
- Business performance monitoring
- Operational dashboards
- Management reporting
For students and professionals, this creates an opportunity to develop a skill that connects data analysis with business decision-making.
What Is a Power BI Course?
A Power BI course teaches you how to use Microsoft’s business intelligence and data visualization platform to work with data and create meaningful reports.
A practical course generally covers the complete workflow:
Data → Cleaning → Transformation → Modeling → Analysis → Visualization → Dashboard → Business Insights
Instead of learning individual features without understanding how they work together, students should learn how Power BI is used in a real data analytics workflow.
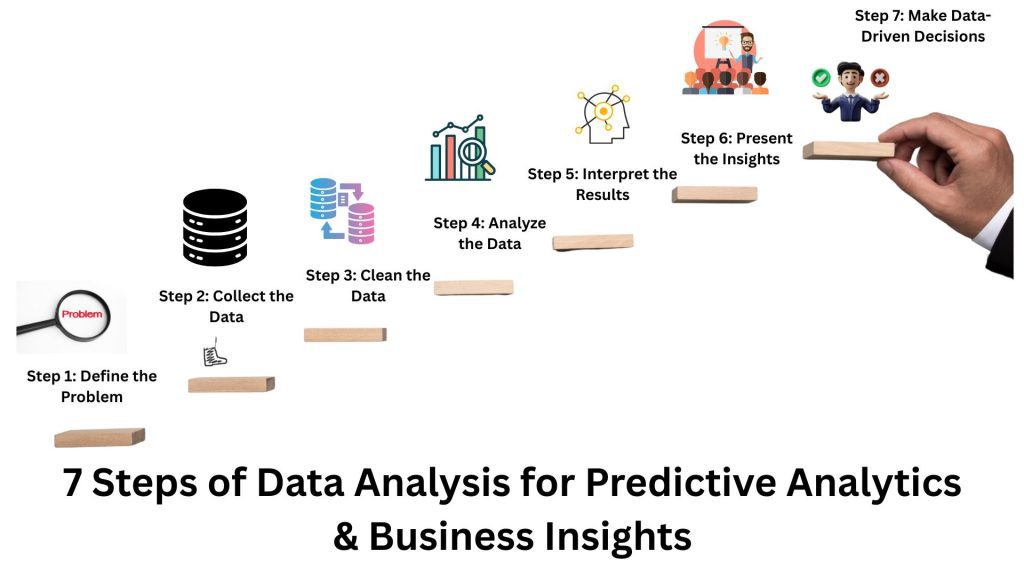
A good training program should help you understand:
- How to import datasets
- How to clean data
- How to transform data
- How to create relationships
- How to build a data model
- How to write basic and advanced DAX calculations
- How to create interactive visualizations
- How to design dashboards
- How to analyze business performance
- How to present insights
Why Choose a Power BI Course in Chandigarh?
Chandigarh and the surrounding Tricity region have a growing technology, education, services, and business ecosystem. This makes Chandigarh an attractive location for students and professionals who want to develop technology and analytics skills.
Choosing a Power BI course in Chandigarh can provide learners with a structured environment where they can combine classroom learning with practical projects.
For students, classroom-based training can also make it easier to ask questions, practice concepts, and receive guidance while working on projects.
A local training environment can be particularly useful if you are looking for:
- Practical instructor-led learning
- Project-based training
- Career-oriented guidance
- Support while creating dashboards
- Hands-on data analytics exercises
- Learning alongside other students
- Guidance for building a portfolio
The goal should not simply be to complete a Power BI course. The goal should be to develop enough practical ability to use Power BI confidently.
Power BI Course in Chandigarh for Freshers
Freshers often face a common problem: they have academic knowledge but limited practical experience.
An Ai course in mohali for freshers would be relevant to AI training, but for analytics careers, a Power BI course in Chandigarh for freshers can provide a focused entry point into business intelligence and data visualization.
Freshers can start with basic concepts and gradually move toward advanced dashboard development.
A beginner-friendly learning path may include:
- Introduction to data analytics
- Introduction to Power BI
- Connecting different data sources
- Data cleaning
- Power Query
- Data transformation
- Data modeling
- Relationships
- DAX fundamentals
- Data visualization
- Dashboard design
- Advanced calculations
- Project development
- Business reporting
- Portfolio preparation
This approach helps students build skills progressively instead of trying to learn advanced concepts immediately.
Artificial Intelligence and Power BI: Understanding the Difference
It is important not to confuse Power BI with Artificial Intelligence.
An Artificial Intelligence course in Mohali generally focuses on areas such as machine learning, AI applications, automation, natural language processing, or computer vision.
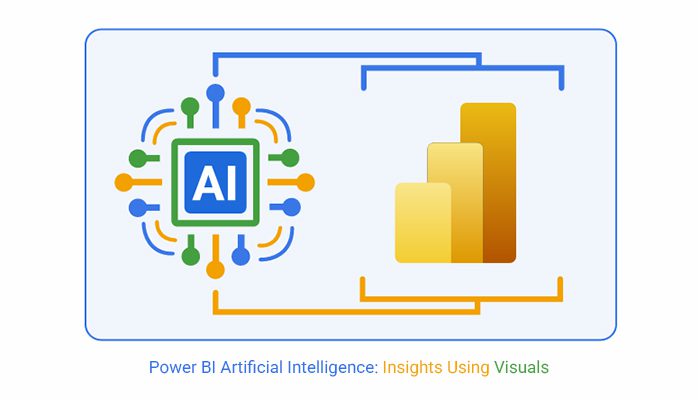
Power BI, on the other hand, primarily focuses on business intelligence, data analysis, reporting, and visualization.
However, modern analytics increasingly brings these areas together.
For example, an organization may use:
Python → Data Processing → Machine Learning → Power BI → Business Dashboard
A data professional could analyze a dataset using Python, build predictive models, and then present selected business insights through Power BI.
This is why Power BI can work well alongside skills such as:
- Python
- Excel
- SQL
- Data Analytics
- Statistics
- Machine Learning
- Cloud computing
What Will You Learn in a Power BI Course?
A comprehensive Power BI training program should cover both fundamentals and practical applications.
Introduction to Power BI
Students first learn the Power BI environment and understand how business intelligence tools are used.
Important beginner concepts include:
- Power BI interface
- Reports
- Dashboards
- Visuals
- Filters
- Data sources
- Workspaces
- Basic reporting concepts
This foundation makes later topics easier to understand.
Data Import and Data Sources
Real-world data rarely comes from a single clean file.
Power BI can work with different types of data sources. Depending on the project, learners may work with:
- Excel files
- CSV files
- Databases
- Text-based data
- Online sources
- Other supported business data sources
Students learn how to bring data into Power BI and prepare it for analysis.
Power Query and Data Cleaning
One of the most important parts of Power BI training is data preparation.
Real-world datasets often contain:
- Missing values
- Duplicate records
- Incorrect formats
- Unnecessary columns
- Inconsistent names
- Empty rows
- Date-format problems
Power Query provides tools for transforming this data.
Students can learn tasks such as:
- Removing duplicates
- Changing data types
- Renaming columns
- Splitting columns
- Combining columns
- Filtering rows
- Replacing values
- Merging datasets
- Appending datasets
Understanding data cleaning is essential because poor-quality input data can lead to poor analysis.
Data Modeling in Power BI
After cleaning the data, the next step is creating a useful data model.
Data modeling helps Power BI understand how different tables are connected.
For example, a sales project may contain:
- Customer table
- Product table
- Sales table
- Date table
These tables can be connected using appropriate relationships.
Students should understand concepts such as:
- Tables
- Fields
- Relationships
- Primary keys
- Data types
- Fact tables
- Dimension tables
- Model structure
A good data model can make reports easier to maintain and calculations more reliable.
DAX: The Analytical Power Behind Power BI
DAX, or Data Analysis Expressions, is one of the most important topics in a Power BI course.
DAX allows users to create calculations and analytical measures.
Beginners can start with functions such as:
SUMAVERAGECOUNTCOUNTROWSMINMAXIF
As their skills improve, learners can explore concepts involving:
- Measures
- Calculated columns
- Filter context
- Time-based analysis
- Conditional calculations
- Percentage calculations
- Year-over-year comparisons
The objective is not to memorize hundreds of formulas. Instead, students should understand why a calculation is needed and how to create it.
Creating Interactive Power BI Dashboards
Dashboard development is where learners can see the results of their work.
A Power BI report can contain different visual elements such as:
- Bar charts
- Column charts
- Line charts
- Pie and donut charts
- Tables
- Cards
- KPI visuals
- Maps
- Slicers
- Filters
The important part is not simply adding many charts.
A professional dashboard should communicate a clear message.
For example, a sales dashboard might answer:
- What are total sales?
- Which product performs best?
- Which region generates the most revenue?
- How are sales changing over time?
- Which month had the highest performance?
This turns a collection of charts into a useful business intelligence report.
Power BI Dashboard Design Principles
A technically correct dashboard can still be difficult to use if it has poor design.
During a practical Power BI course in Chandigarh, students should also learn basic dashboard design principles.
Keep the Dashboard Simple
Avoid filling the screen with too many visualizations.
Create a Clear Information Hierarchy
Important KPIs should be easy to find.
Use Appropriate Charts
Choose visuals based on the type of information being communicated.
Use Consistent Formatting
Titles, labels, numbers, and layouts should follow a consistent structure.
Focus on Business Questions
Every major visual should have a purpose.
A good dashboard should help someone understand the data quickly.
Power BI Skills Compared With Other Data Analytics Skills
Power BI is most valuable when combined with other analytical skills.
| Skill | Main Purpose | Beginner Difficulty | Common Use |
|---|---|---|---|
| Excel | Spreadsheet analysis | Low | Reporting and calculations |
| SQL | Database querying | Medium | Data extraction |
| Power BI | Visualization & BI | Medium | Dashboards and reports |
| Python | Programming & analysis | Medium | Data processing and automation |
| Statistics | Analytical reasoning | Medium | Understanding data |
| Machine Learning | Predictive analysis | High | Prediction and classification |
Instead of thinking of these technologies as competitors, learners should see them as complementary skills.
For example:
SQL can retrieve data.
Python can process and analyze data.
Power BI can turn the results into interactive business reports.
Practical Projects in a Power BI Course
Projects are an important part of professional learning.
Instead of only following classroom examples, learners should work with realistic datasets.
Possible Power BI projects include:
Sales Dashboard
Analyze:
- Revenue
- Sales quantity
- Product performance
- Regional performance
- Monthly trends
HR Analytics Dashboard
Analyze:
- Employee distribution
- Department performance
- Hiring trends
- Attrition information
- Workforce statistics
Financial Dashboard
Analyze:
- Revenue
- Expenses
- Profit
- Monthly performance
- Budget comparisons
Customer Analytics Dashboard
Analyze:
- Customer segments
- Purchase behavior
- Customer trends
- Sales contribution
- Regional patterns
Projects like these can become part of a student portfolio.
Who Should Join a Power BI Course in Chandigarh?
Power BI is not limited to computer science graduates.
A practical Power BI course can be useful for:
- B.Tech students
- BCA students
- MCA students
- MBA students
- Commerce students
- Statistics students
- Data analytics learners
- Working professionals
- Business analysts
- Aspiring data analysts
- Professionals working with reports
Even non-programmers can learn Power BI because many common reporting tasks are performed through its visual interface.
However, having additional knowledge of Excel, SQL, statistics, or Python can make your analytics profile stronger.
Career Opportunities After Learning Power BI
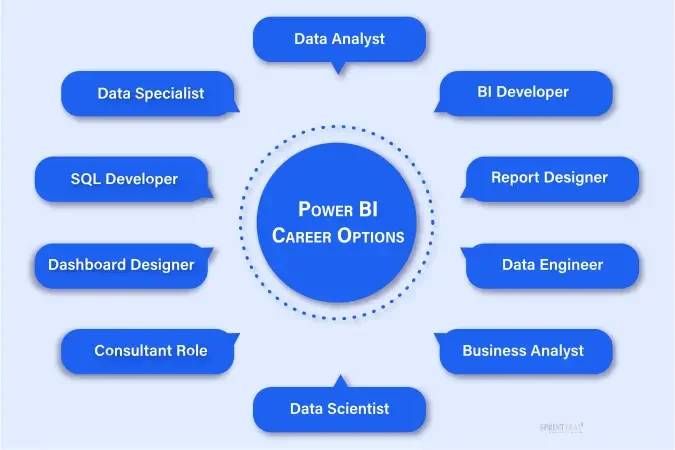
Learning Power BI can support several career paths in data and business intelligence.
Potential roles include:
- Data Analyst
- Business Intelligence Analyst
- Reporting Analyst
- Business Analyst
- Power BI Developer
- MIS Analyst
- Data Visualization Specialist
- Junior BI Consultant
Your actual career options will depend on your education, experience, portfolio, communication skills, and broader technical knowledge.
For freshers, a portfolio can be particularly useful because it demonstrates what you can actually build.
Why Choose The Core Systems for Power BI Training?
The Core Systems is a software development and AI-driven company that also provides technical training for students and industry professionals.
Our training ecosystem covers areas including:
- Data Analytics
- Artificial Intelligence
- Data Science
- Python
- Full-Stack Web Development
- MERN Development
- Python with AI
- IoT and IIoT
- Embedded Systems
- AWS Cloud Computing
- Cyber Security
- Linux
The organization also works on corporate and industrial projects across Chandigarh, Mohali, Punjab, Haryana, and nearby regions.
This project-oriented environment can help learners understand how technical skills connect with real business requirements.
For Power BI learners, the focus should be on building practical ability in data preparation, analysis, visualization, reporting, and dashboard development.
Power BI and the Future of Data Analytics
The future of analytics is increasingly focused on helping businesses make faster and better decisions.
Tools like Power BI are part of a larger analytics ecosystem that includes:
- Cloud computing
- Artificial intelligence
- Machine learning
- Data engineering
- Databases
- Automation
- Business intelligence
AI is also changing how people interact with data. Modern analytics tools increasingly aim to make data exploration easier through natural-language experiences and intelligent features.
For learners, this means that the strongest career strategy is not to learn one tool in isolation.
Instead, build a broader foundation:
Data + SQL + Excel + Power BI + Python + AI
You do not need to master everything at once. Start with one skill, build projects, and gradually expand your technical knowledge.
For additional information about developments in data analytics and business intelligence, consider following reputable technology publications and official documentation such as [Insert link to a reputable technology journal or Microsoft Power BI documentation].
Conclusion: Start Your Power BI Journey in Chandigarh
Data analytics has become an important part of modern business, and professionals who can transform raw information into clear insights are valuable across many industries.
A Power BI course in Chandigarh can help students and professionals develop practical skills in data cleaning, data modeling, DAX, visualization, reporting, and dashboard development.
For freshers, Power BI can provide a practical introduction to the world of business intelligence. For working professionals, it can add an important analytics skill to an existing career profile.
The most effective approach is to learn Power BI through hands-on practice and real-world projects, rather than focusing only on theoretical concepts.